Prometheus 是什么 🔗
Prometheus 是 SoundCloud 公司开源的系统监控告警工具。2016 年,继 k8s 后,作为第二个托管项目加入了云原生计算基金会。这个项目拥有着非常活跃的开发者和用户社区,随着云原生和 k8s的推广,越来越多的公司的运维都是使用 Prometheus + Grafana(可视化) 的这一套。
Prometheus 以时序数据的形式收集和存储其指标,同时支持添加自定义 label 的可选键值对
监控对象 🔗
- 硬件状态:电源状态、CPU 状态、机器温度、风扇状态…
- 服务器基础:CPU,内存,磁盘,网络 使用情况
- 数据库: MySQL, ES …
- 中间件:Nginx, MQ..
- 应用:QPS,接口延时,线程数…
Prometheus 优势 🔗
其他方案
- Zabbix: 1998 年诞生… 属于传统主机监控,主要用于物理主机,交换机,网络等监控
- Graphite: 专注于两件事,存储时序数据, 可视化数据, 其它功能都要安装插件实现, Prometheus 功能丰富:趋势,查询…
- InfluxDB: 时序数据库… 监控部分自己搞,prometheus 不仅仅局限于存储时序数据
- Nagios:90 年代诞生…
- Sensu :可以看作 Nagiosde 的升级版本
- Open-falcon:小米开源,社区活跃度一般
优势
- 云原生支持好,K8s 和 Etcd 等一列项目都提供了对 Prometheus 的原生支持,是目前容器监控最流行的方案
- Prometheus 属于一站式监控告警平台,依赖少,功能齐全。
- 多维数据模型,聚合统计更方便
- 强大的查询语句
劣势
- 数据存储扩展性不够好
Prometheus 架构 🔗
- Sever:抓取(pull 模式)和存储时序数据,提供查询接口
- Exporter:服务监控上报数据,如 MySQL、Redis、Node Exporter
- AlertManger:告警通知
- Pushgetaway: 支持主动向 Sever push 数据,适用于生命周期短暂/批处理的任务。

安装与使用 🔗
安装 官方教程
走过的一个坑
- Prometheus 使用 docker 安装,node exporter 在本机跑,网络不通。建议不使用 docker 安装
前提
- mac
- 安装 prometheus。能打开 http://localhost:9090/
- 安装 node export。能打开 http://localhost:9100/
- 配置好了 prometheus.yml(配置 node exporter 地址,server 通过这个地址 pull 数据)。http://localhost:9090/ 选择 targes,出现两个,如下图即安装成功。
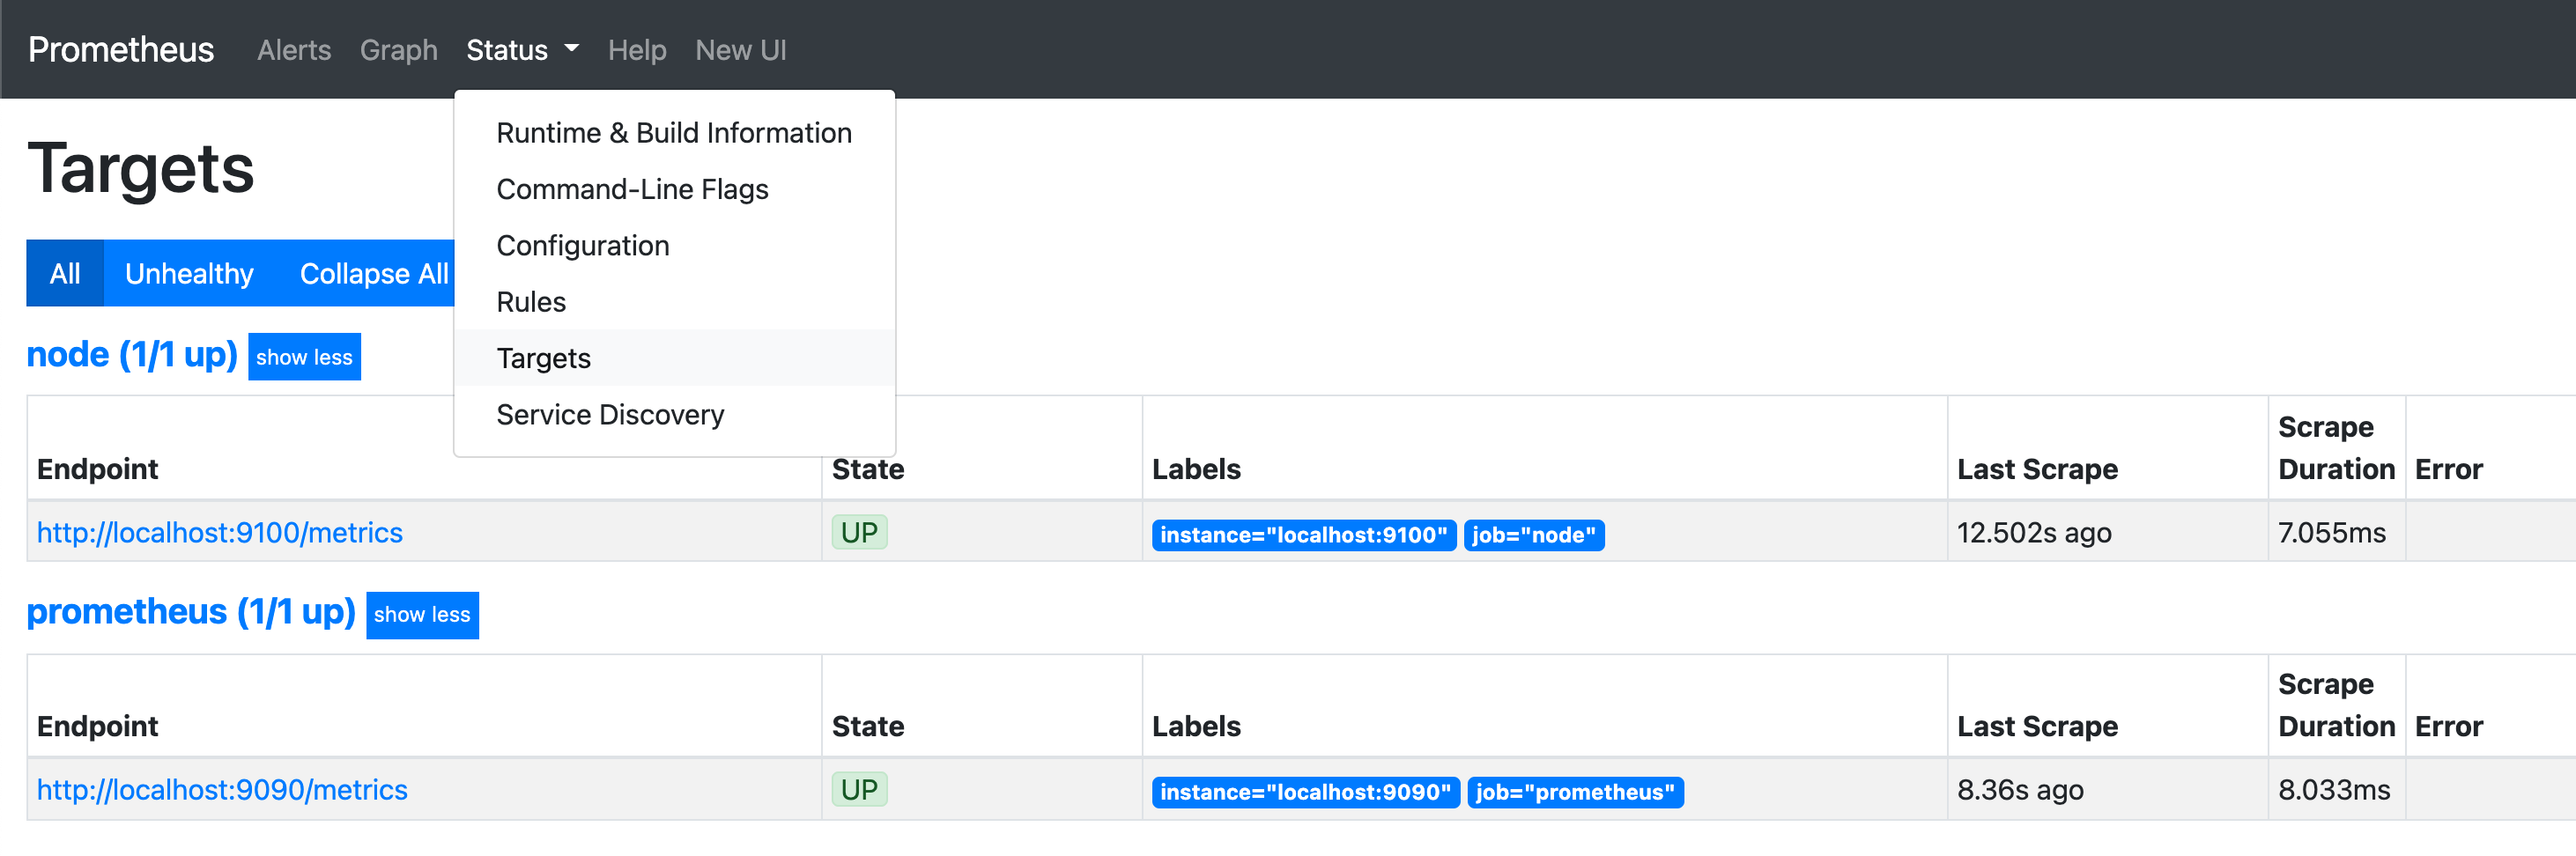
默认有两个 label: job和instance,
job指的监控对象,这里 node exporter 是官方提供的监控机器状态的instance是监控服务地址,一个 job 一般对应多个 instance。
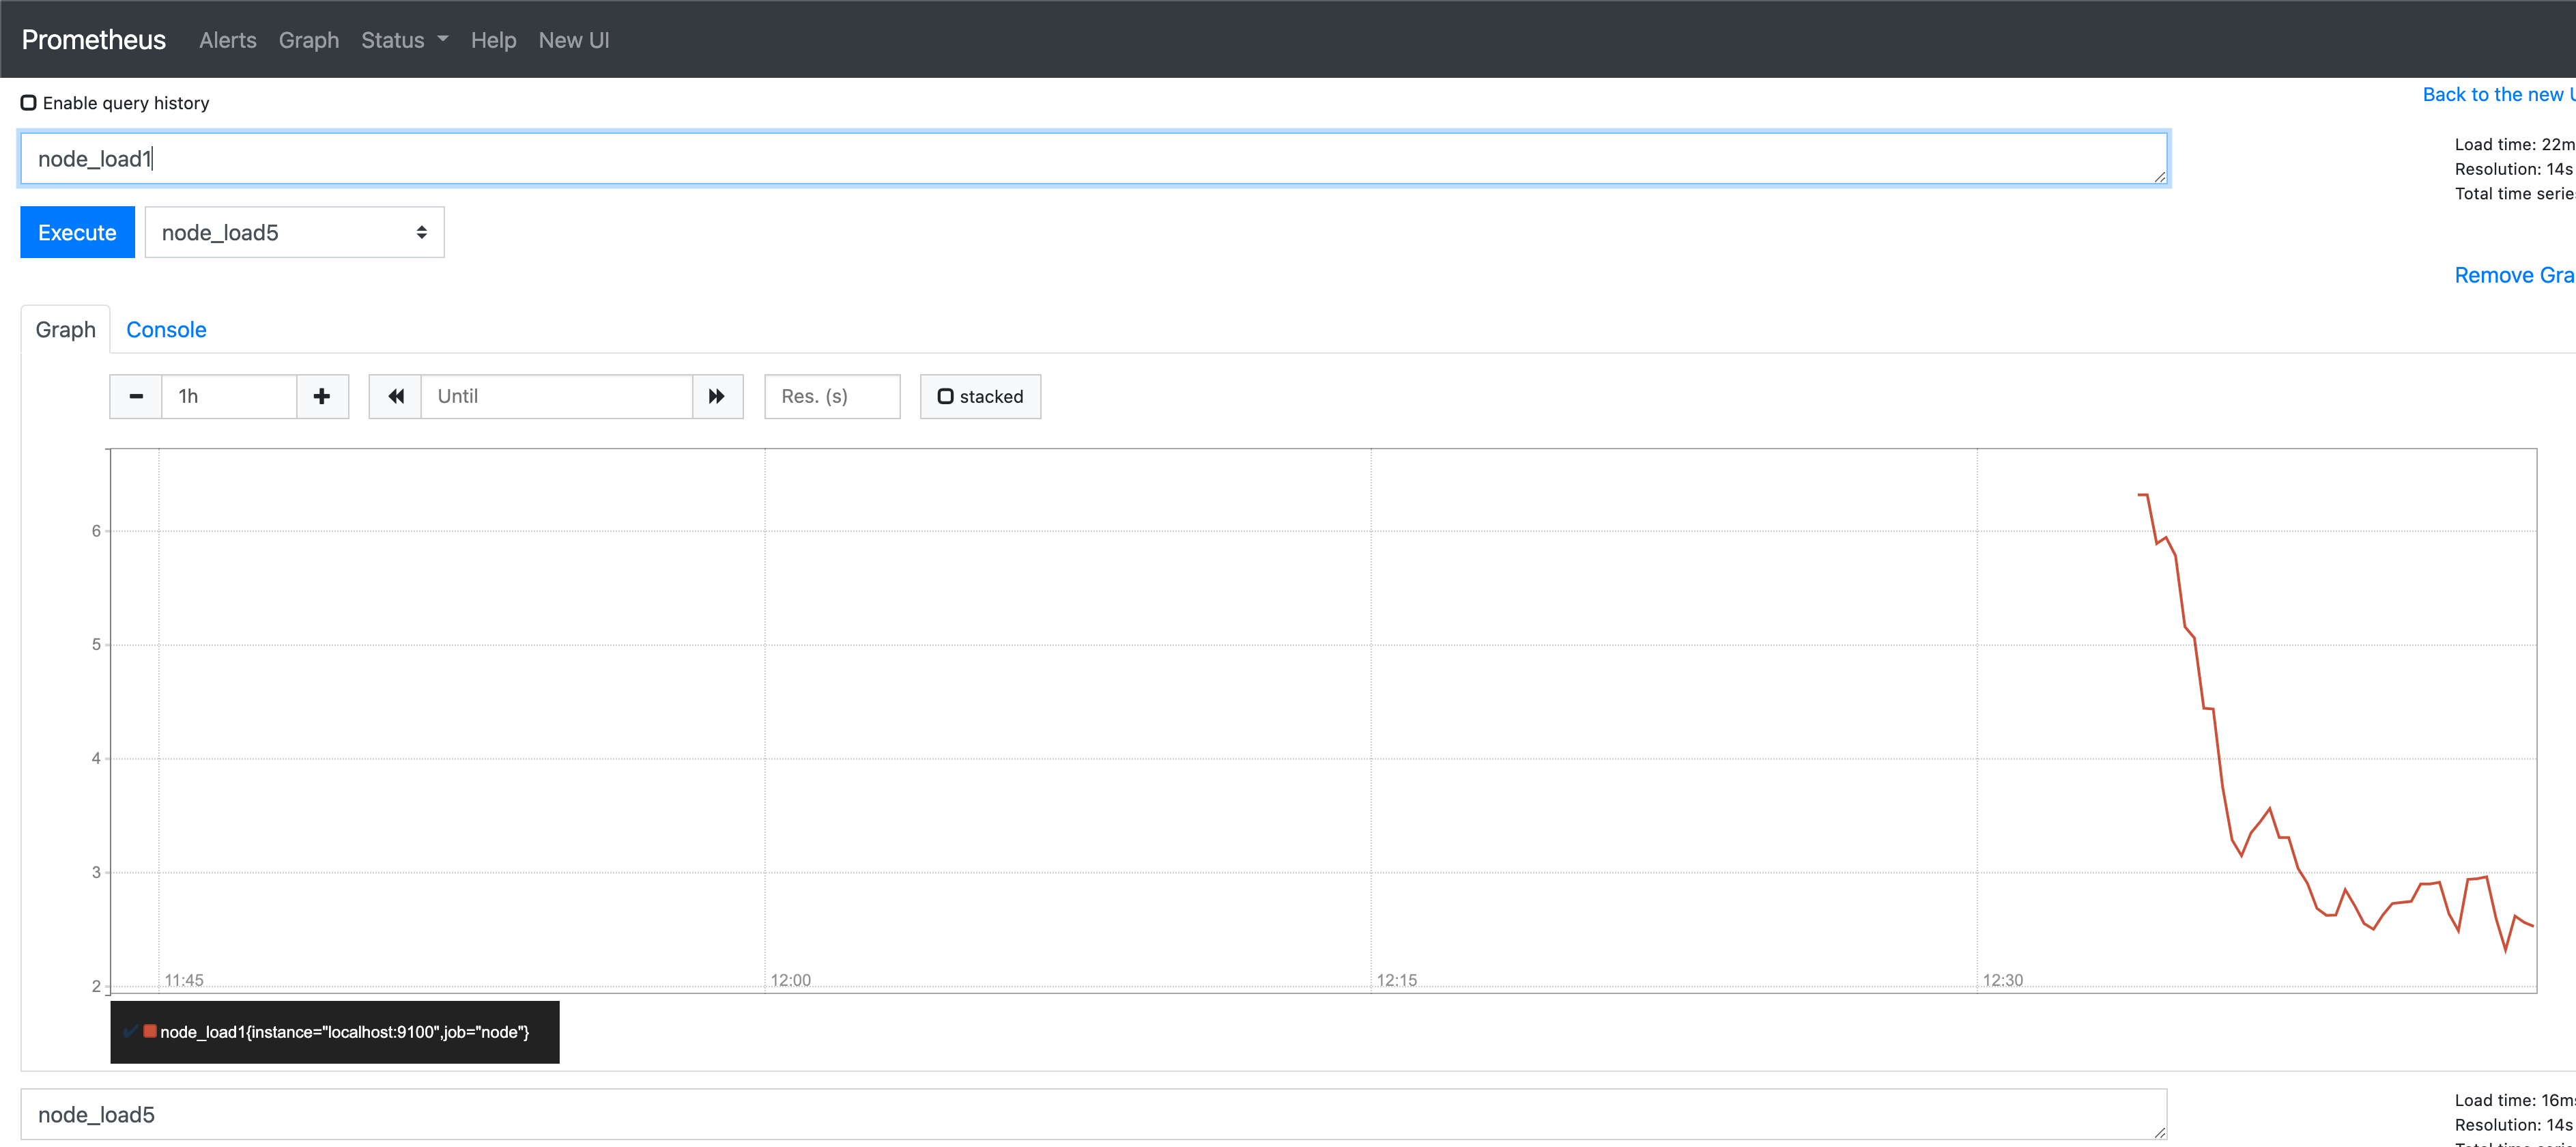
node exporter 提供的监控数据都以 node_开头,下图是 Prometheus 页面中展示的 cpu 负载情况看板。prometheus 提供的可视化功能比较弱,一般搭载 Grafana 使用
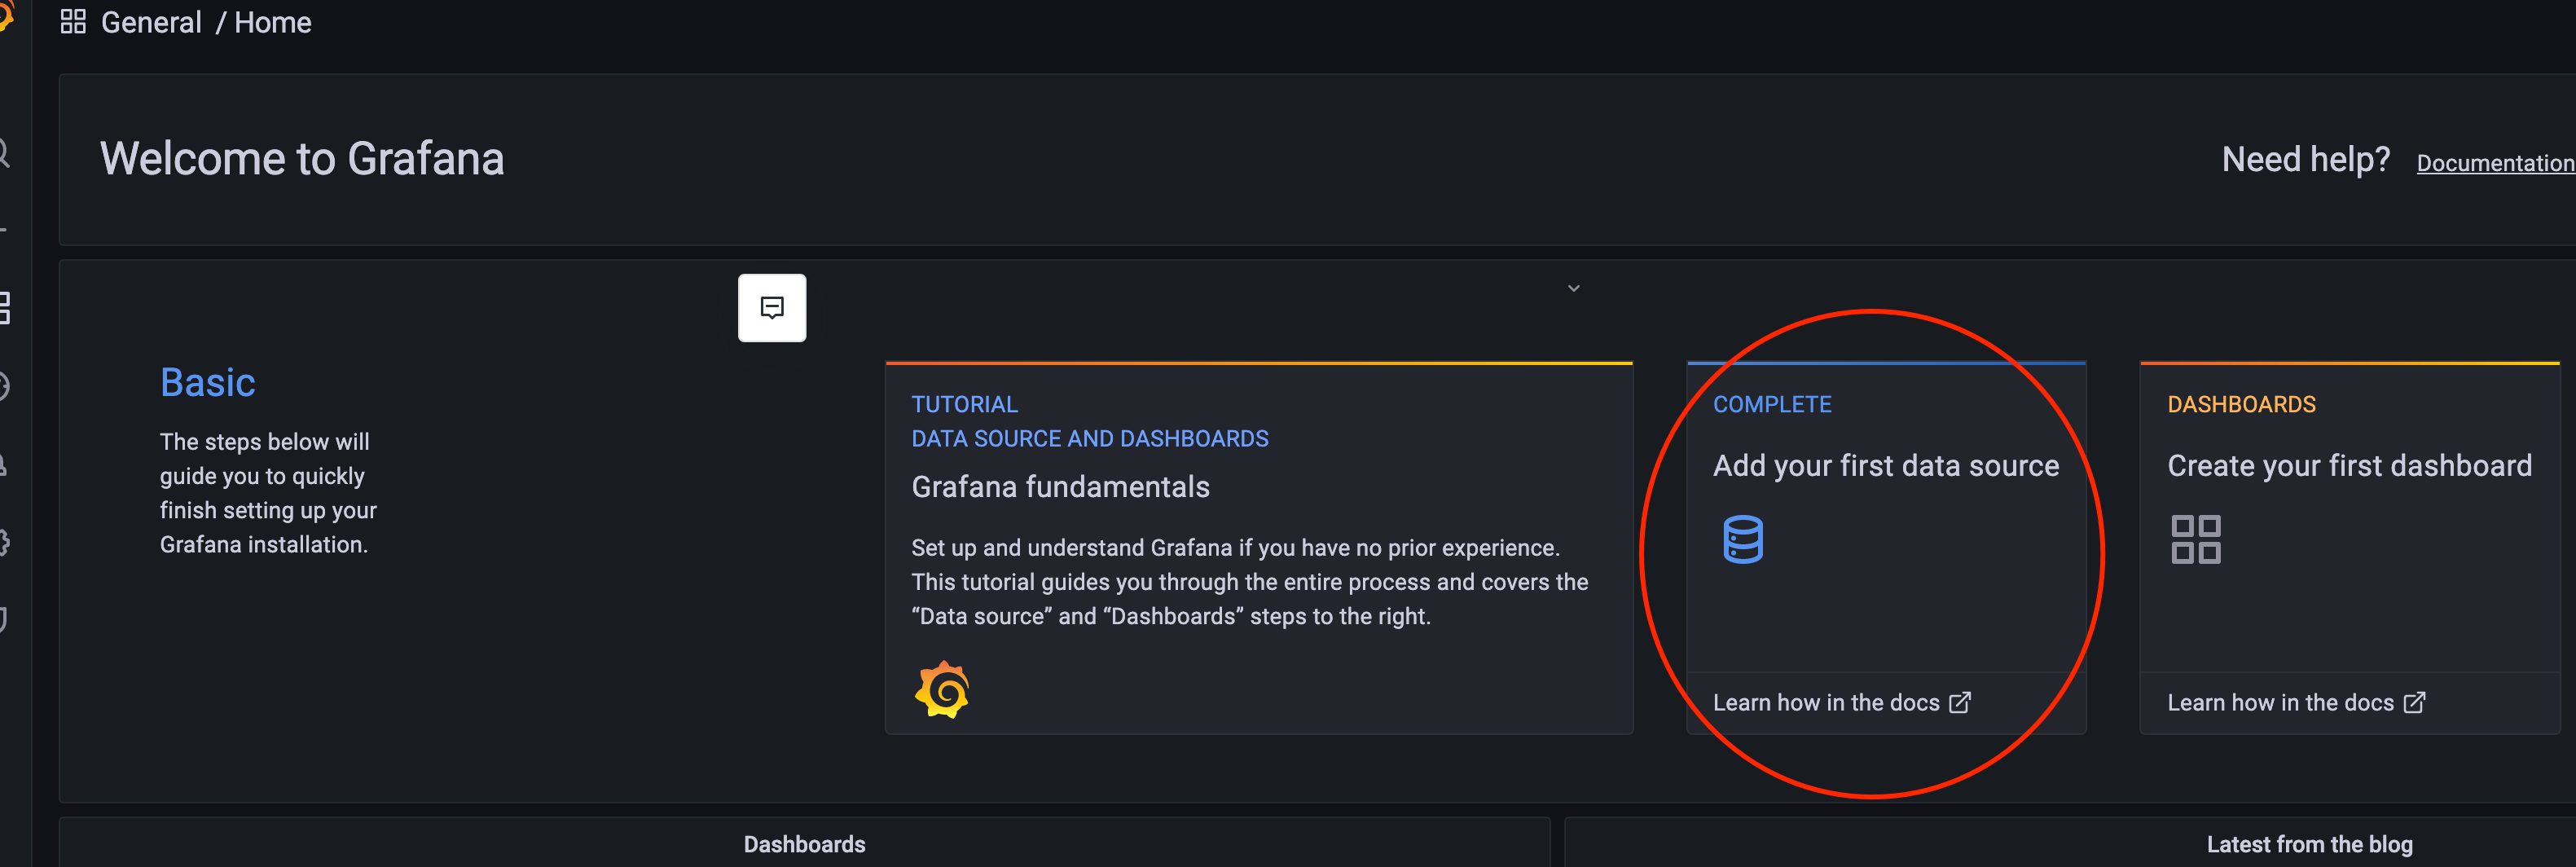
- 安装 Grafana 。能打开 http://localhost:3000/
- 选择 prometheus 作为数据源
- Add panel, 如下图,我在 Grafana 中增加了 cpu_load 的监控看板,可视化功能强大不少
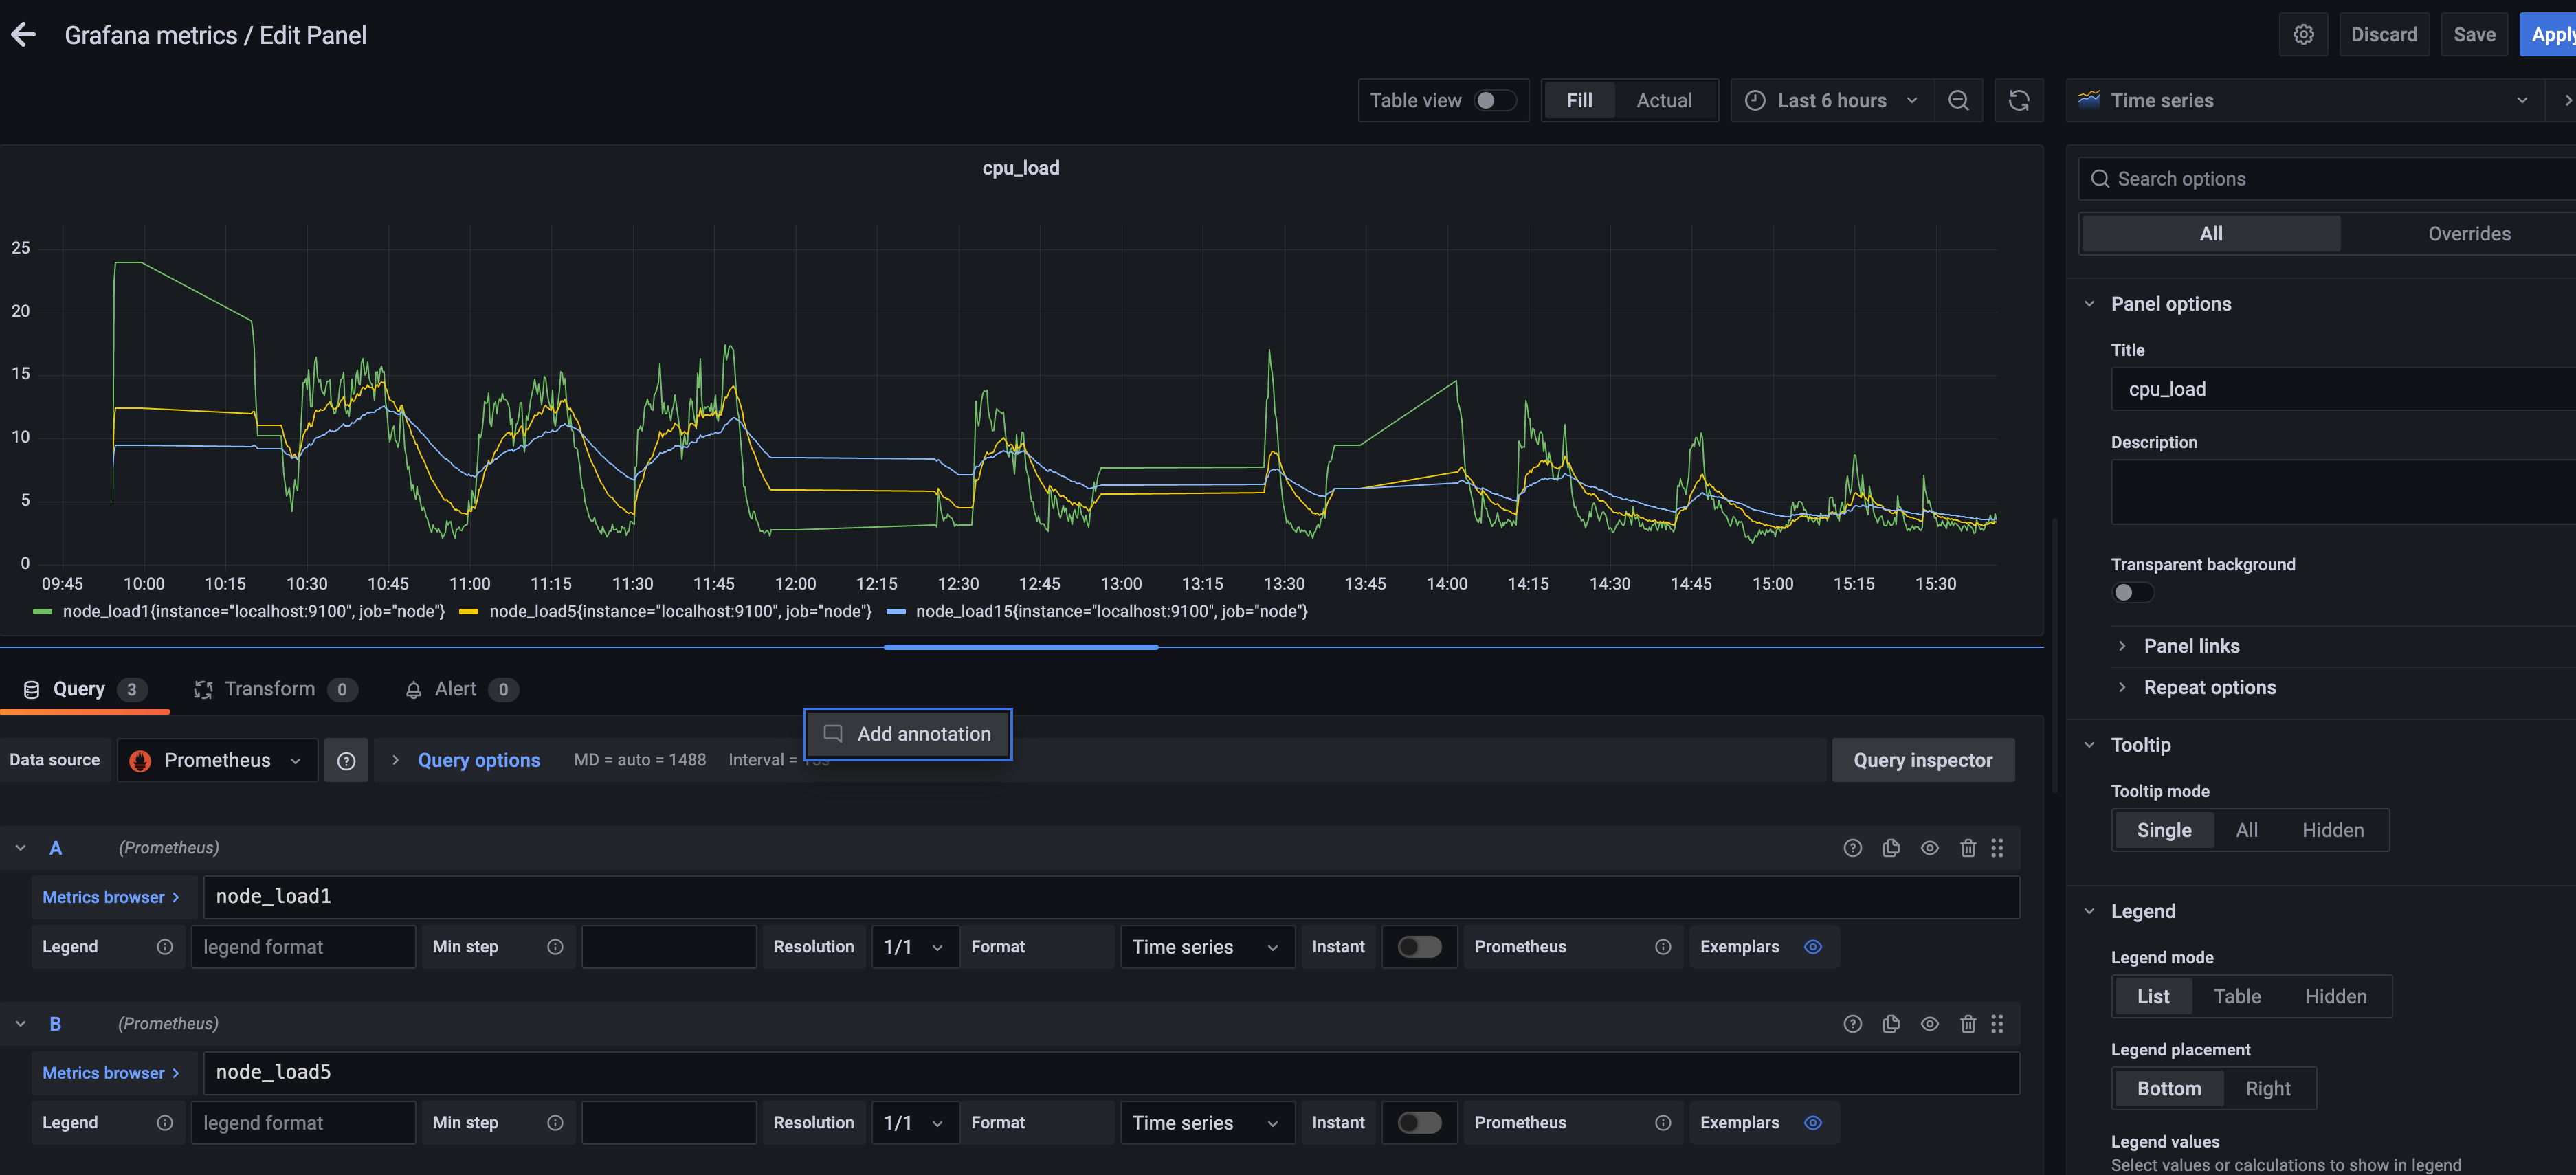
-
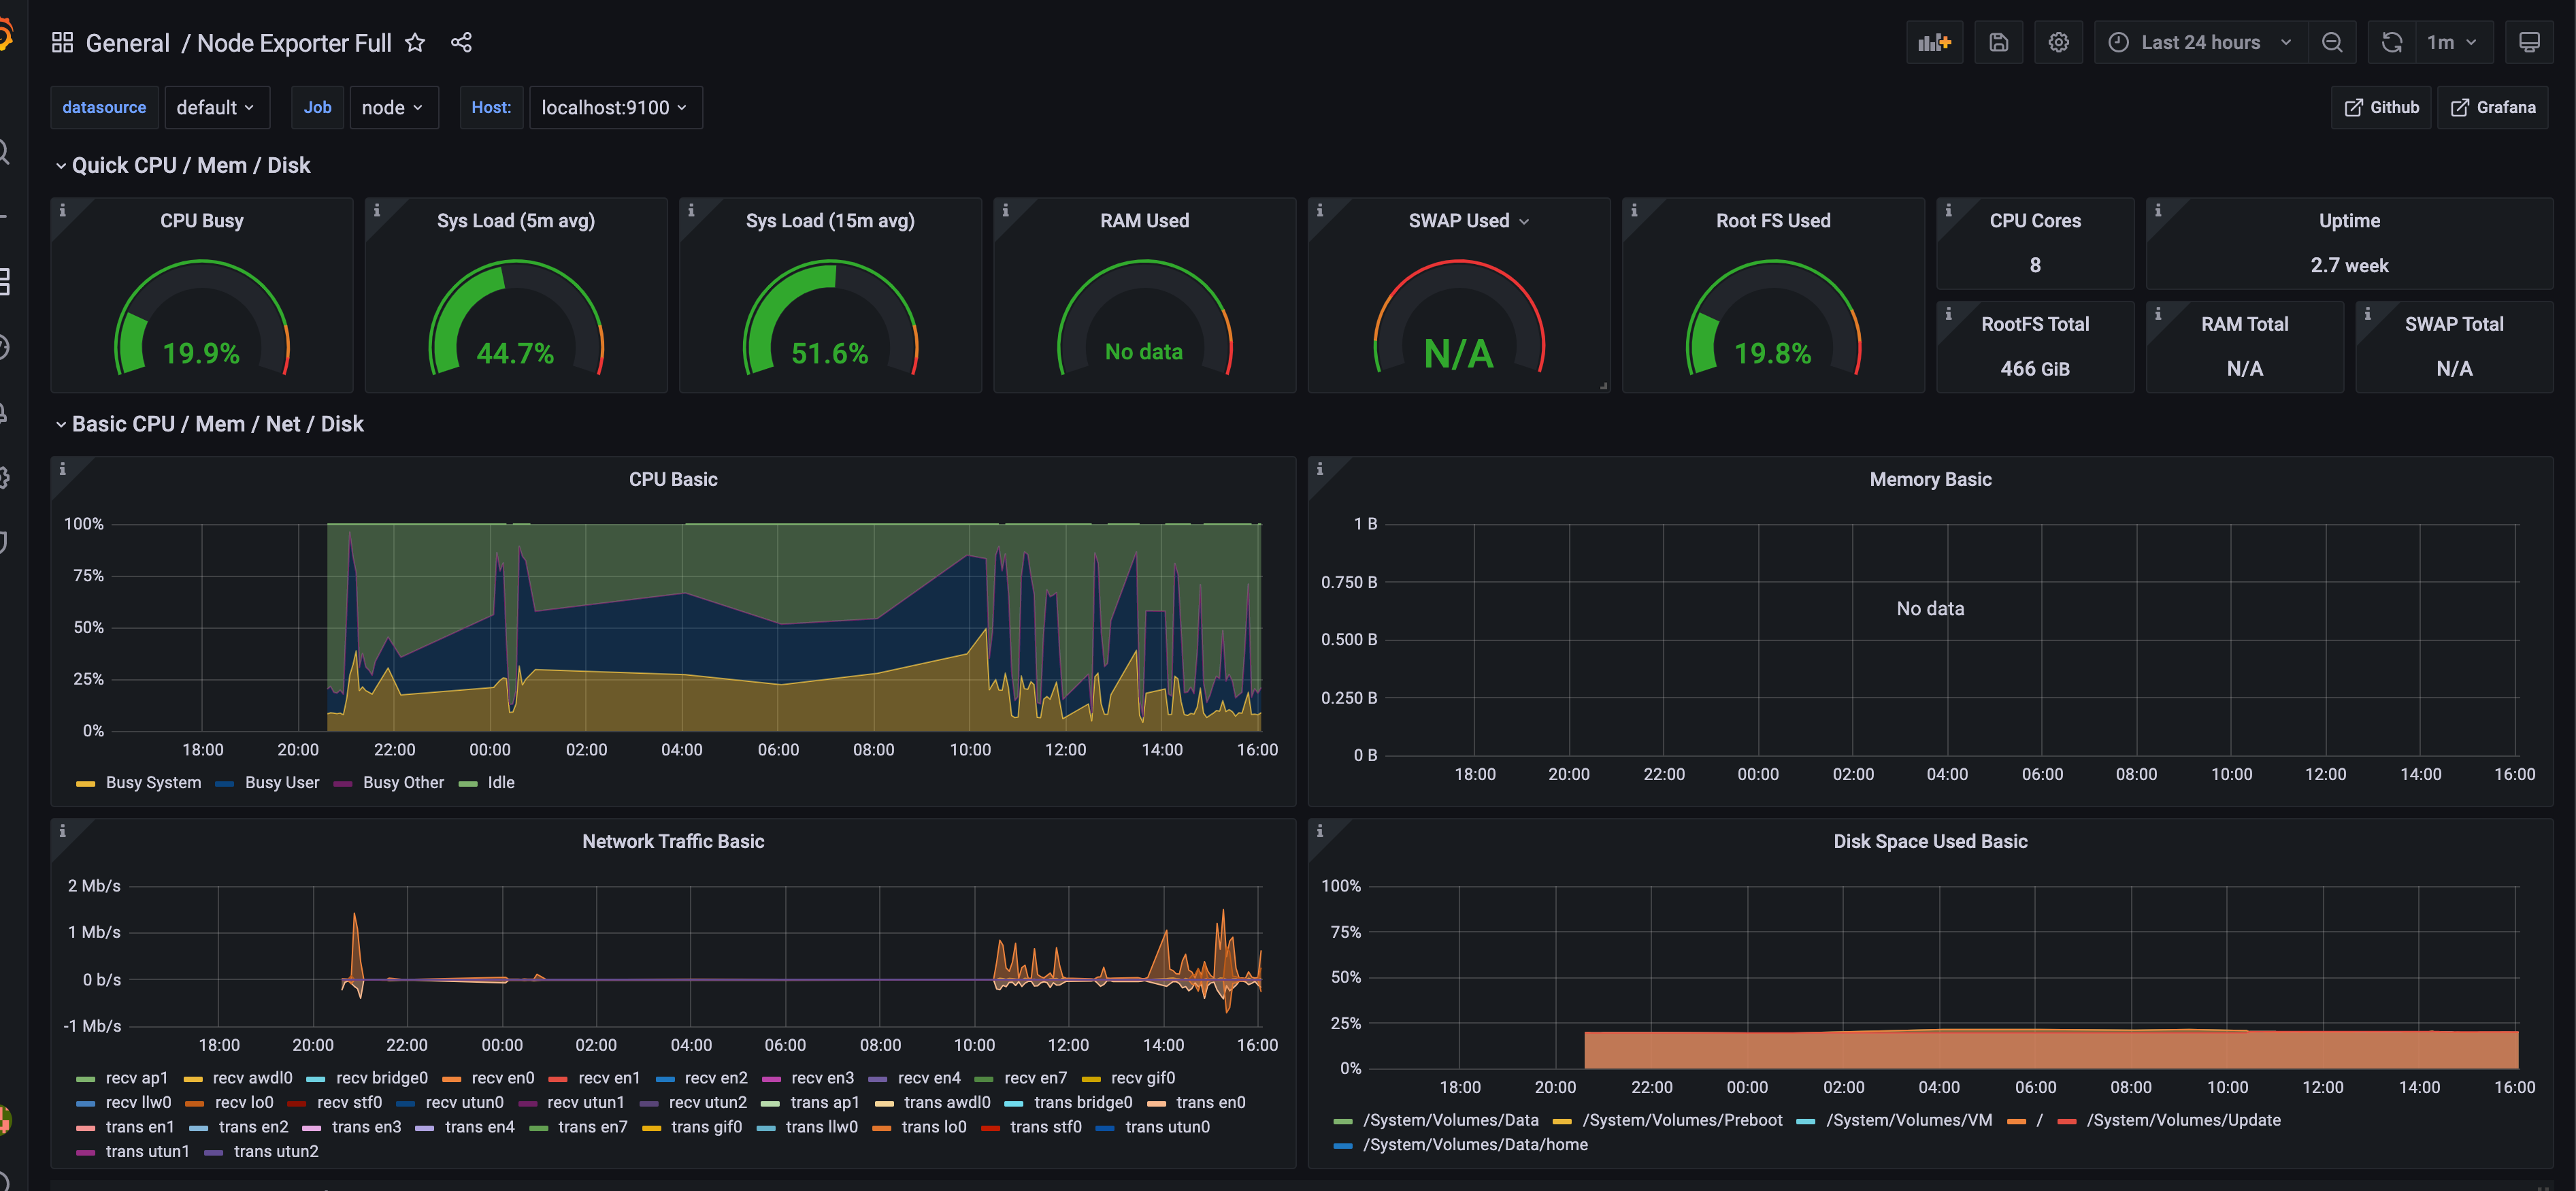
手动添加看板比较麻烦,可以使用 Grafana 模版库
-
模版库中搜索
node_exporter, 复制 ID -
在 Grafana 界面操作:
+->import-> 粘贴 ID -> 选择导入的 prometheus 数据源
一个监控主机数据的完整监控看板就诞生了!
-
总结 🔗
- 介绍了 Prometheus 是什么,它流行的原因
- 介绍了 Prometheus 的总体架构
- 利用 Prometheus、Grafana 、node exporter 展示了快速搭建一个监控看板的过程
下期预告 🔗
- Prometheus 数据类型介绍
- Prometheus 查询语句 PromQL 介绍
- 使用 Prometheus Go client sdk 打点上报自定义指标